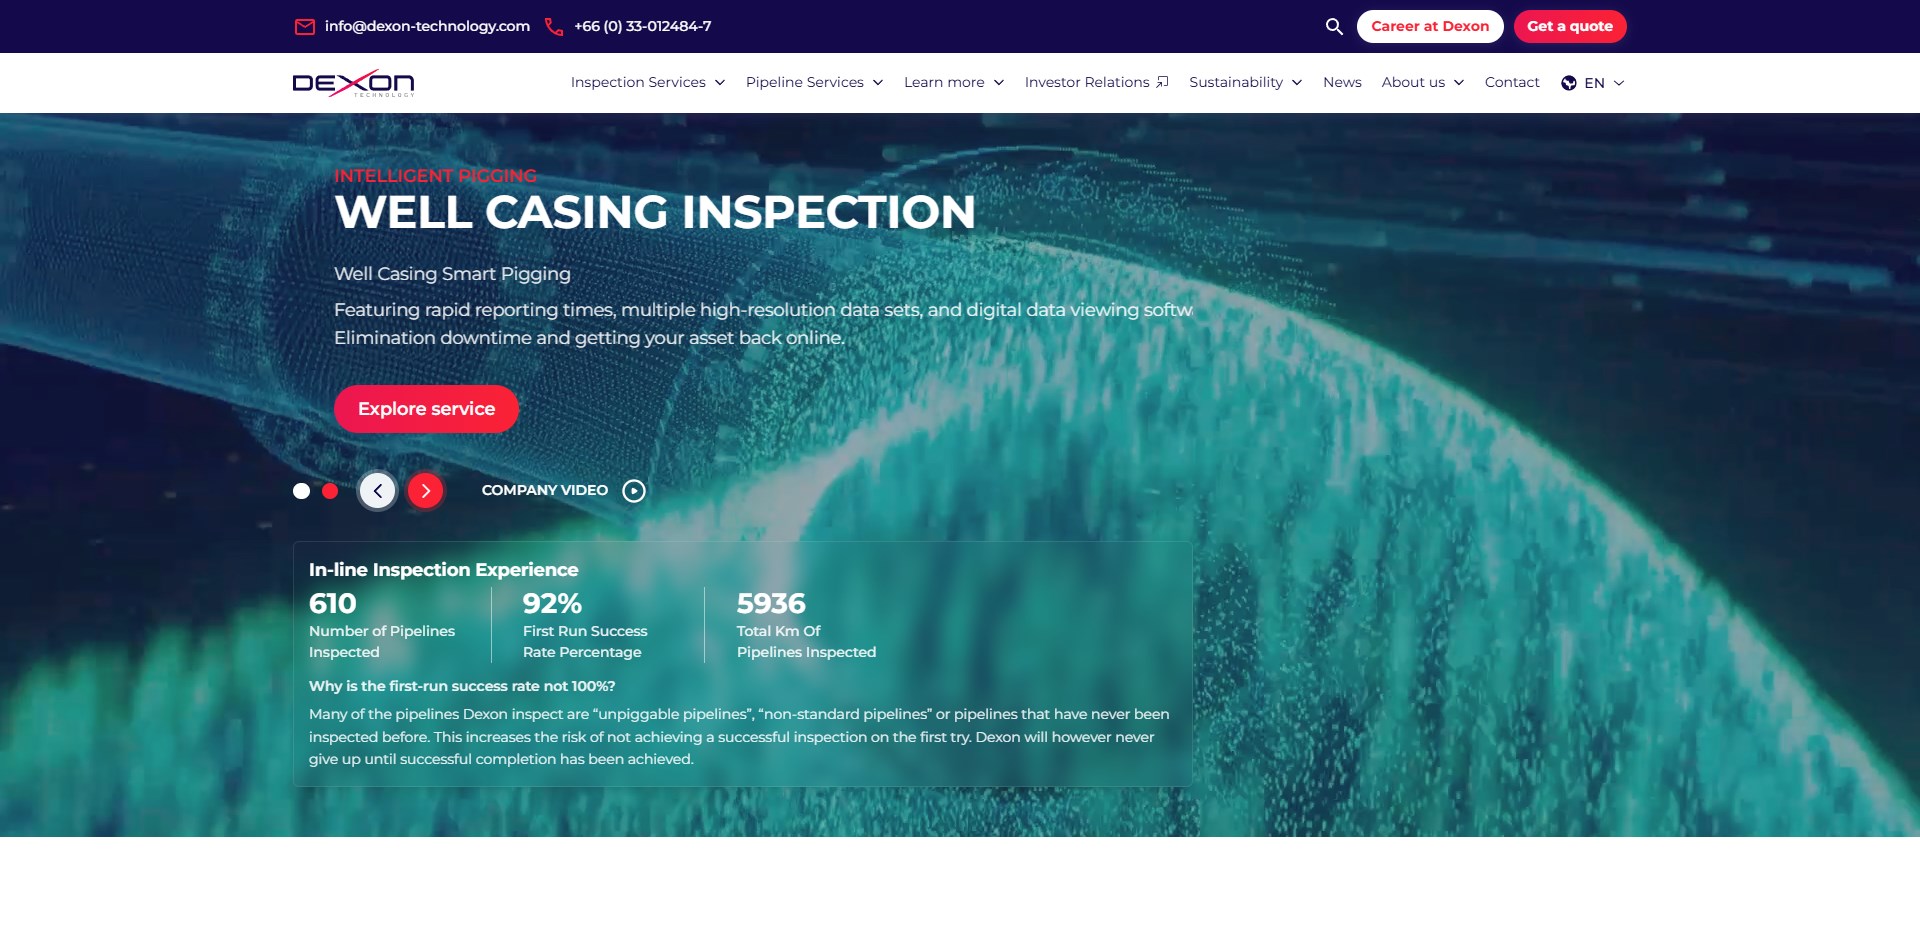
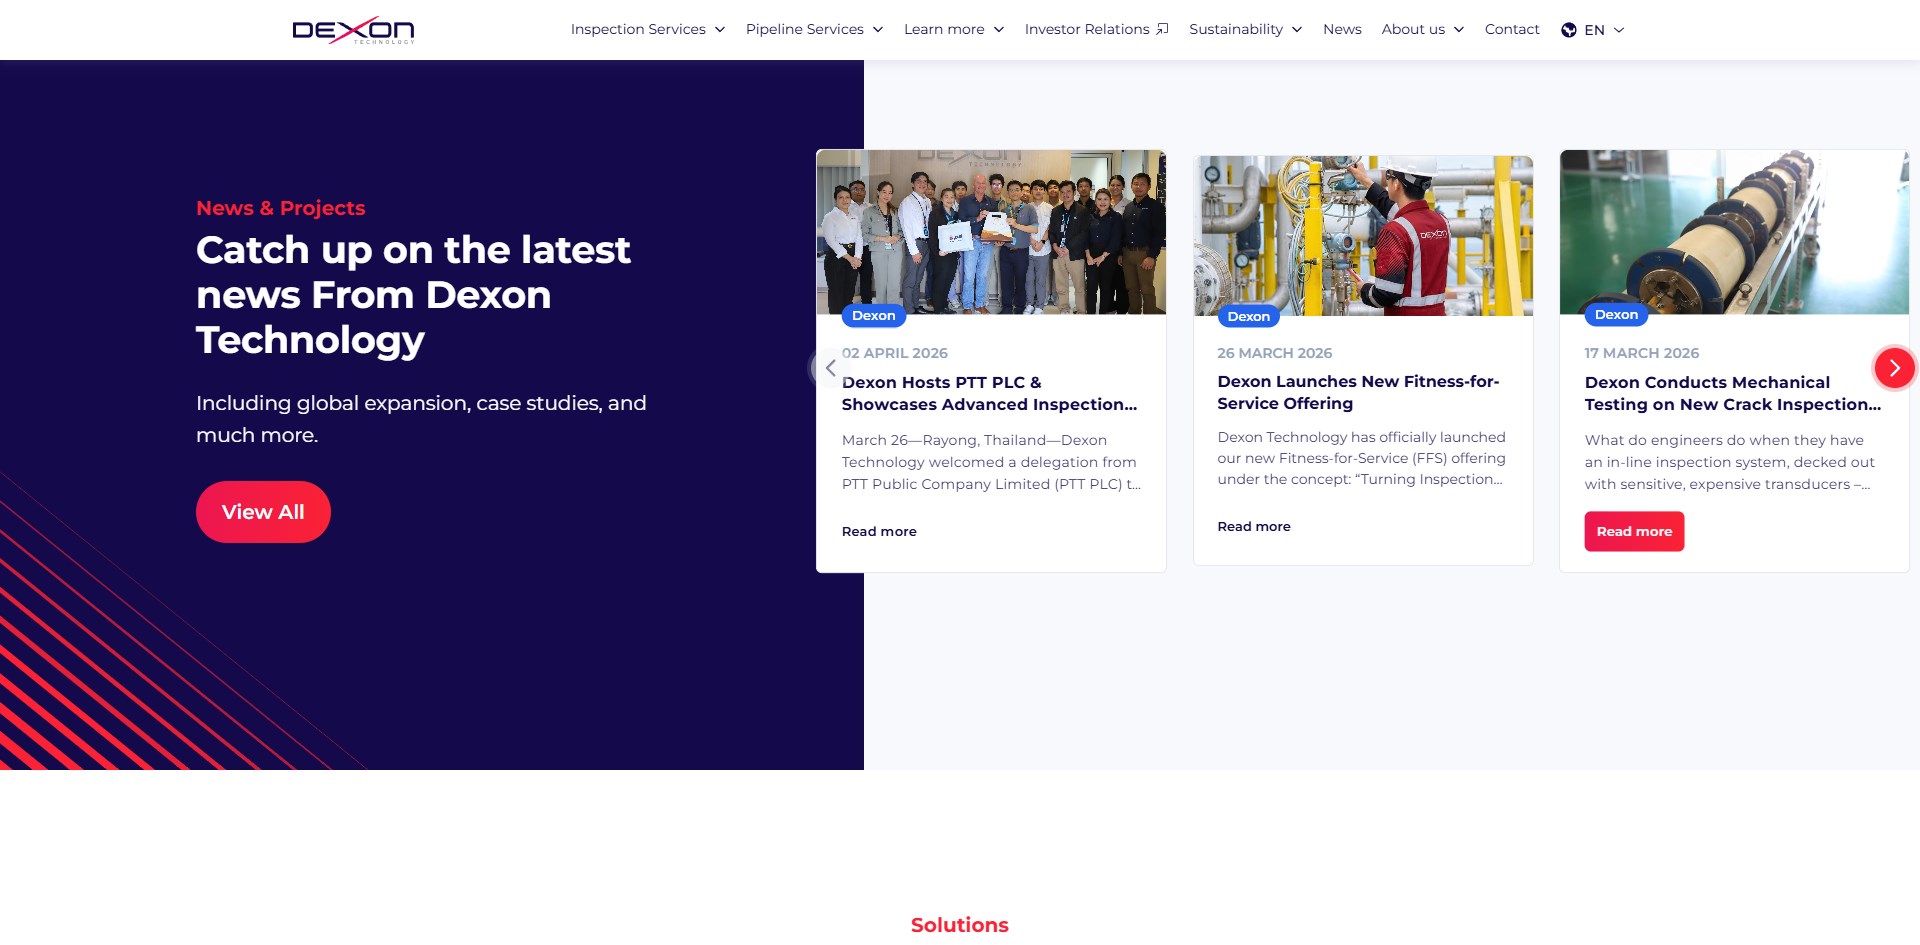
Pipeline Inspection Platform
Client: Dexon Technology PCL
We built the bridge between raw industrial data and human decision-making for a pipeline inspection platform–transforming complex technical…
What we set out to build and why it mattered to Dexon Technology PCL.
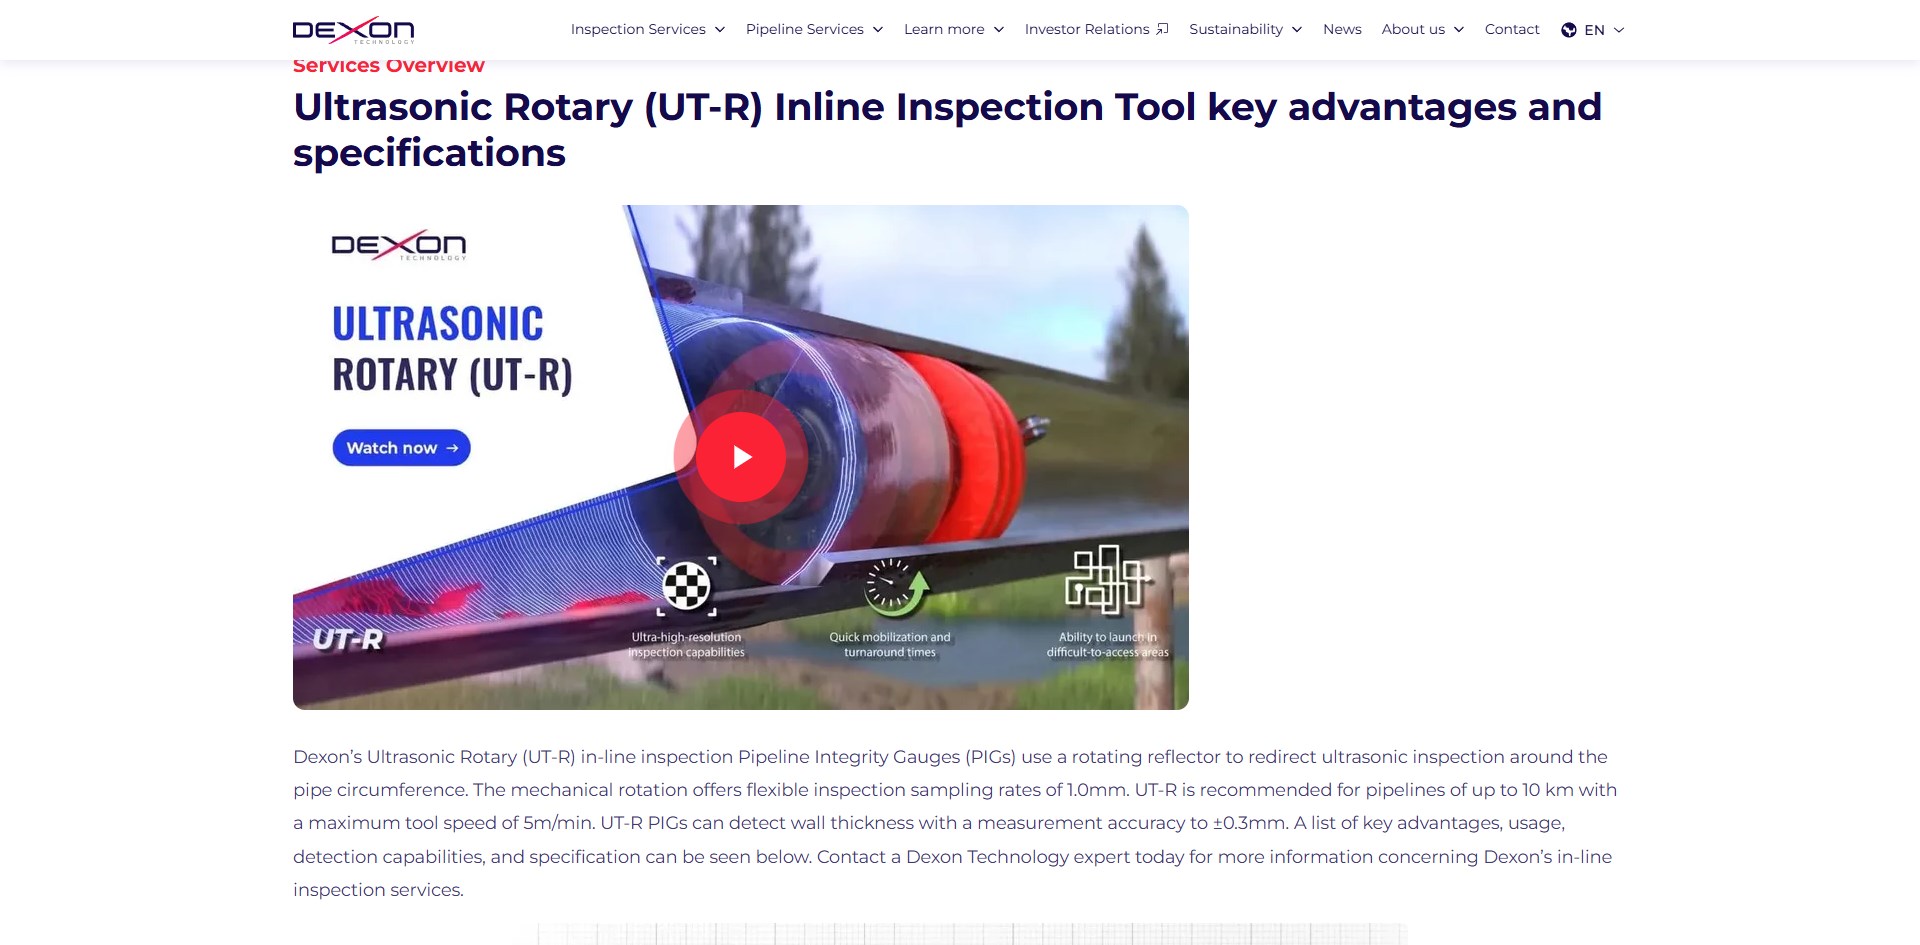
We built the bridge between raw industrial data and human decision-making for a pipeline inspection platform–transforming complex technical datasets into actionable insights for asset integrity management.
Constraints, risks and the problem we had to solve first.
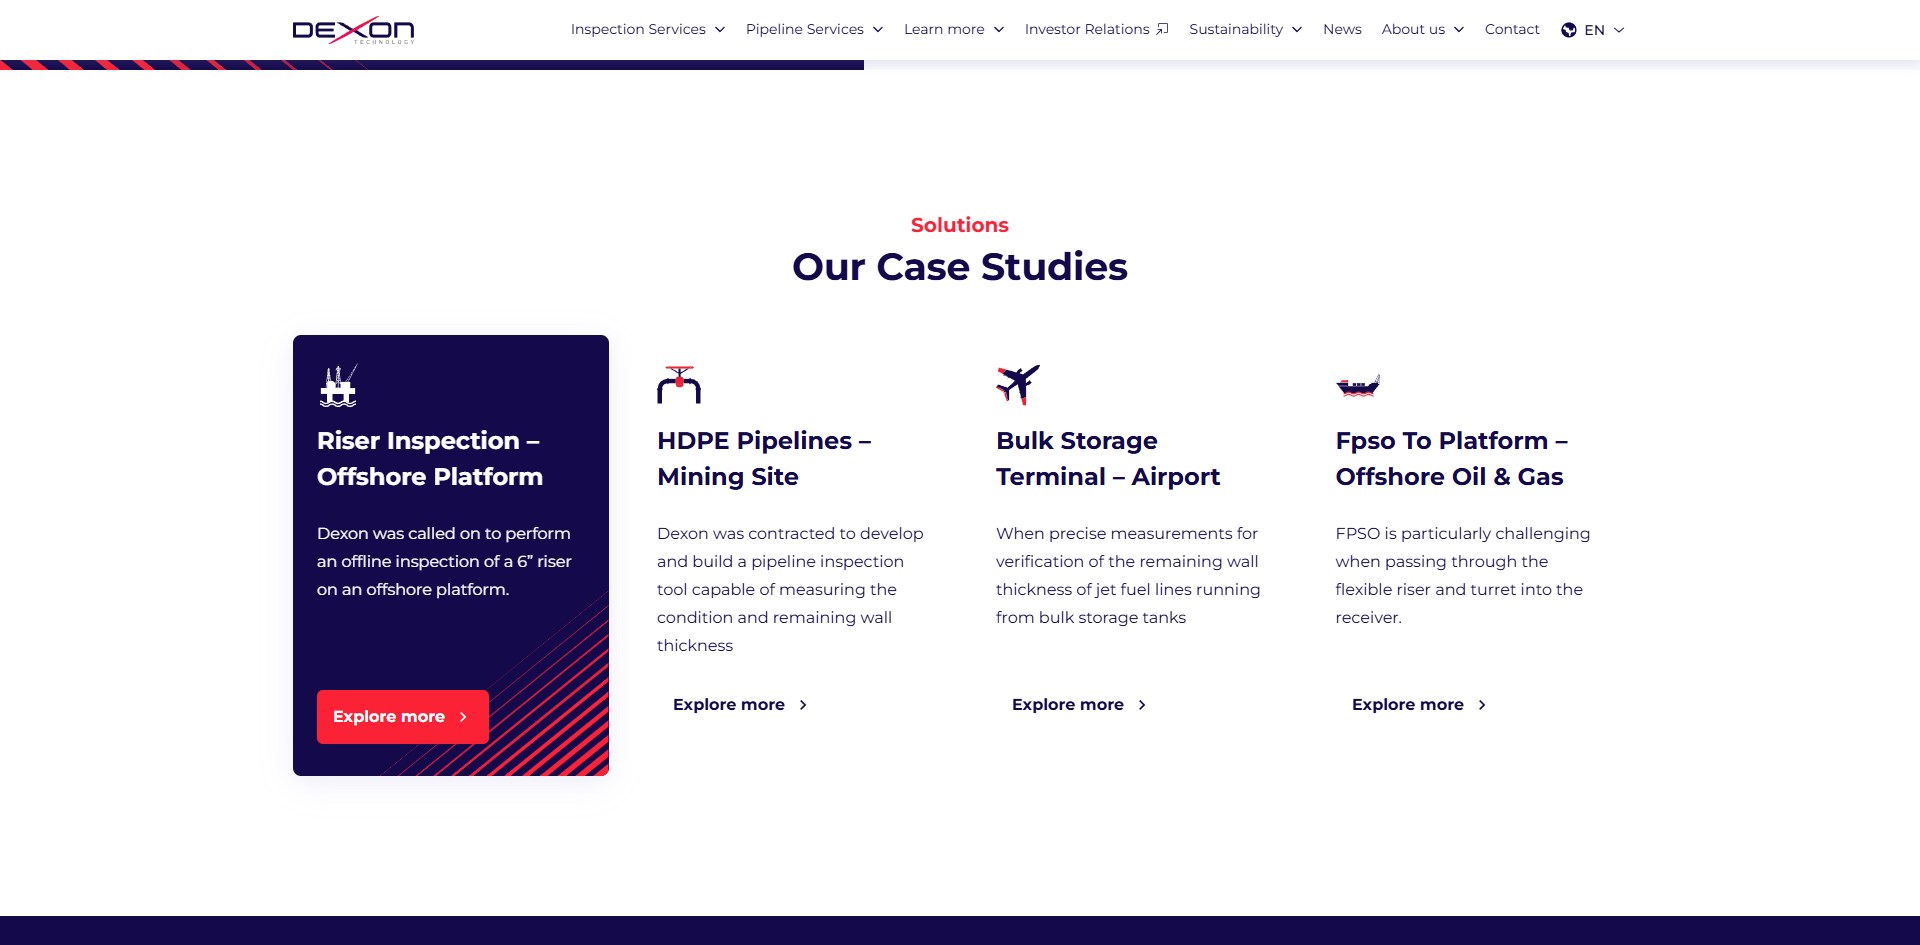
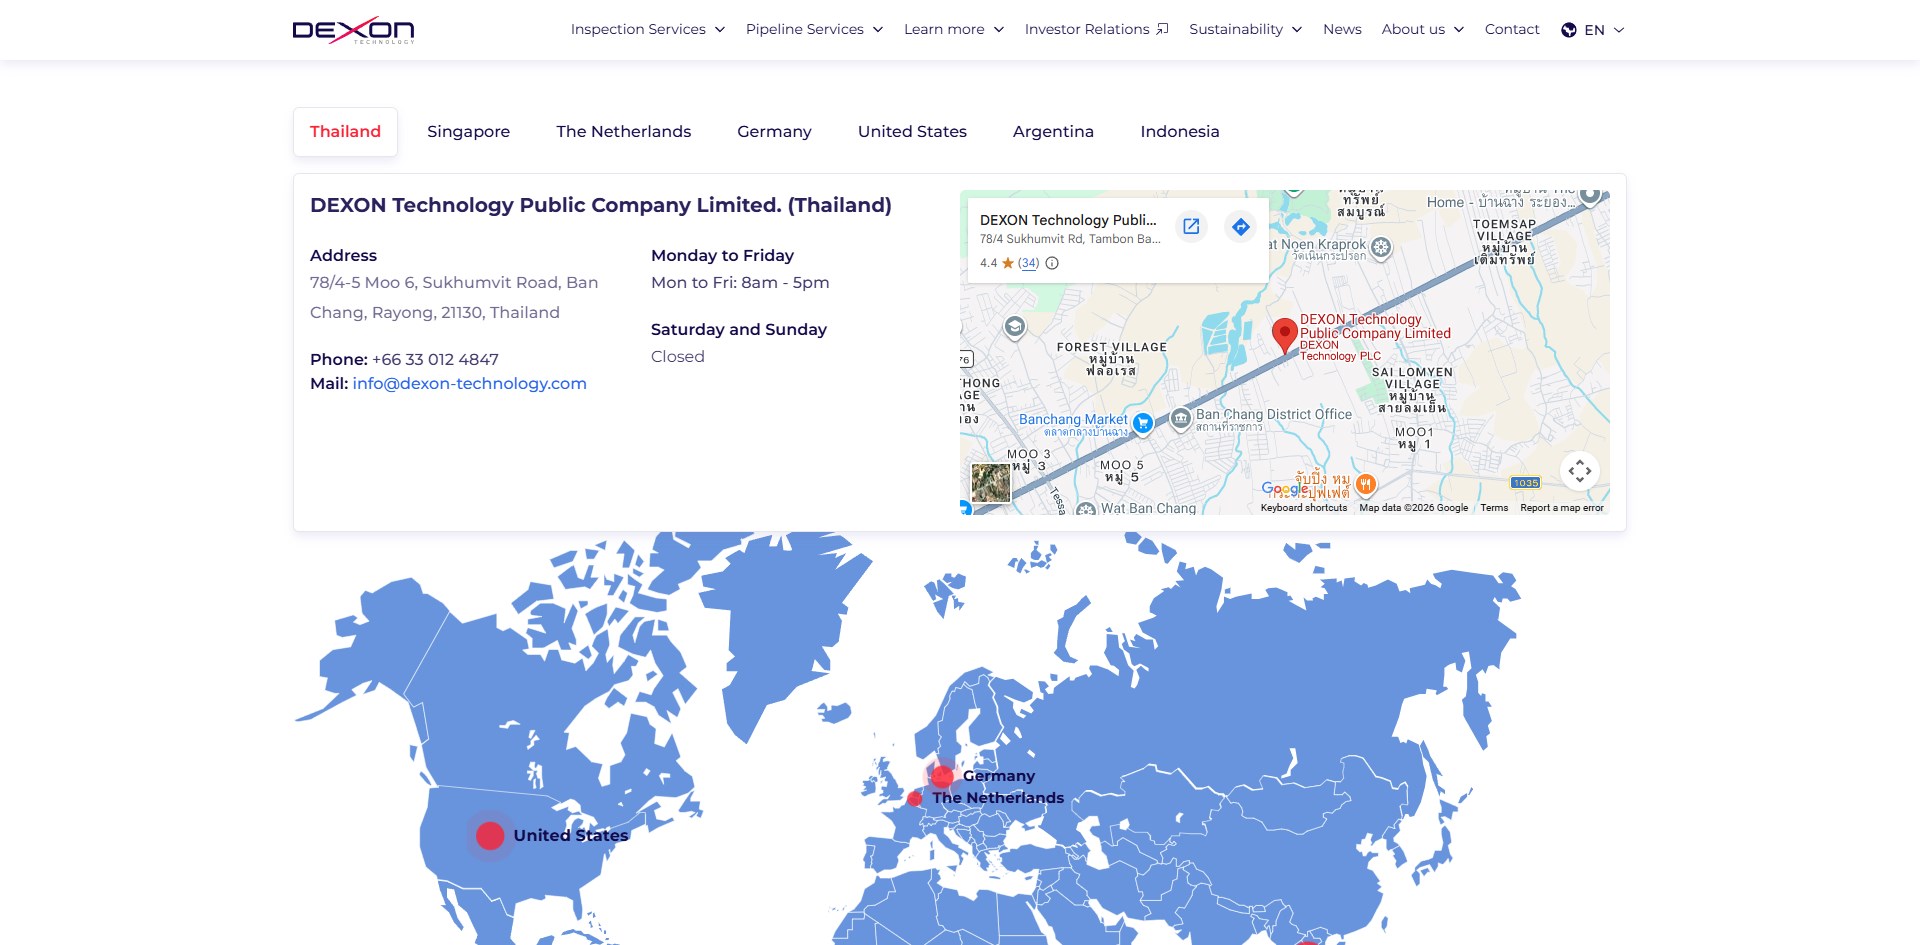
One of the core challenges was providing spatial context for inspection data that spans hundreds of kilometers of pipeline infrastructure. We solved this by engineering an interactive Google Maps API module that plotted complete inspection routes with defect heatmaps and annotations. A key innovation was the integration of Storyblok CMS, transforming static inspection reports into dynamic, editable documents for global field teams.
How we delivered.
- 01
We solved this by engineering an interactive Google Maps API module that plotted complete inspection routes with defect heatmaps and annotations. A key innovation was the integration of Storyblok CMS, transforming static inspection reports into dynamic, editable documents for global field teams.
Languages, runtimes and platforms used to ship this engagement.
“Under the hood, the platform leverages Vue.js and Nuxt.js, Google Maps API, Storyblok CMS, Vuex for real-time data streams, and strategic caching and lazy-loading for performance at scale.”
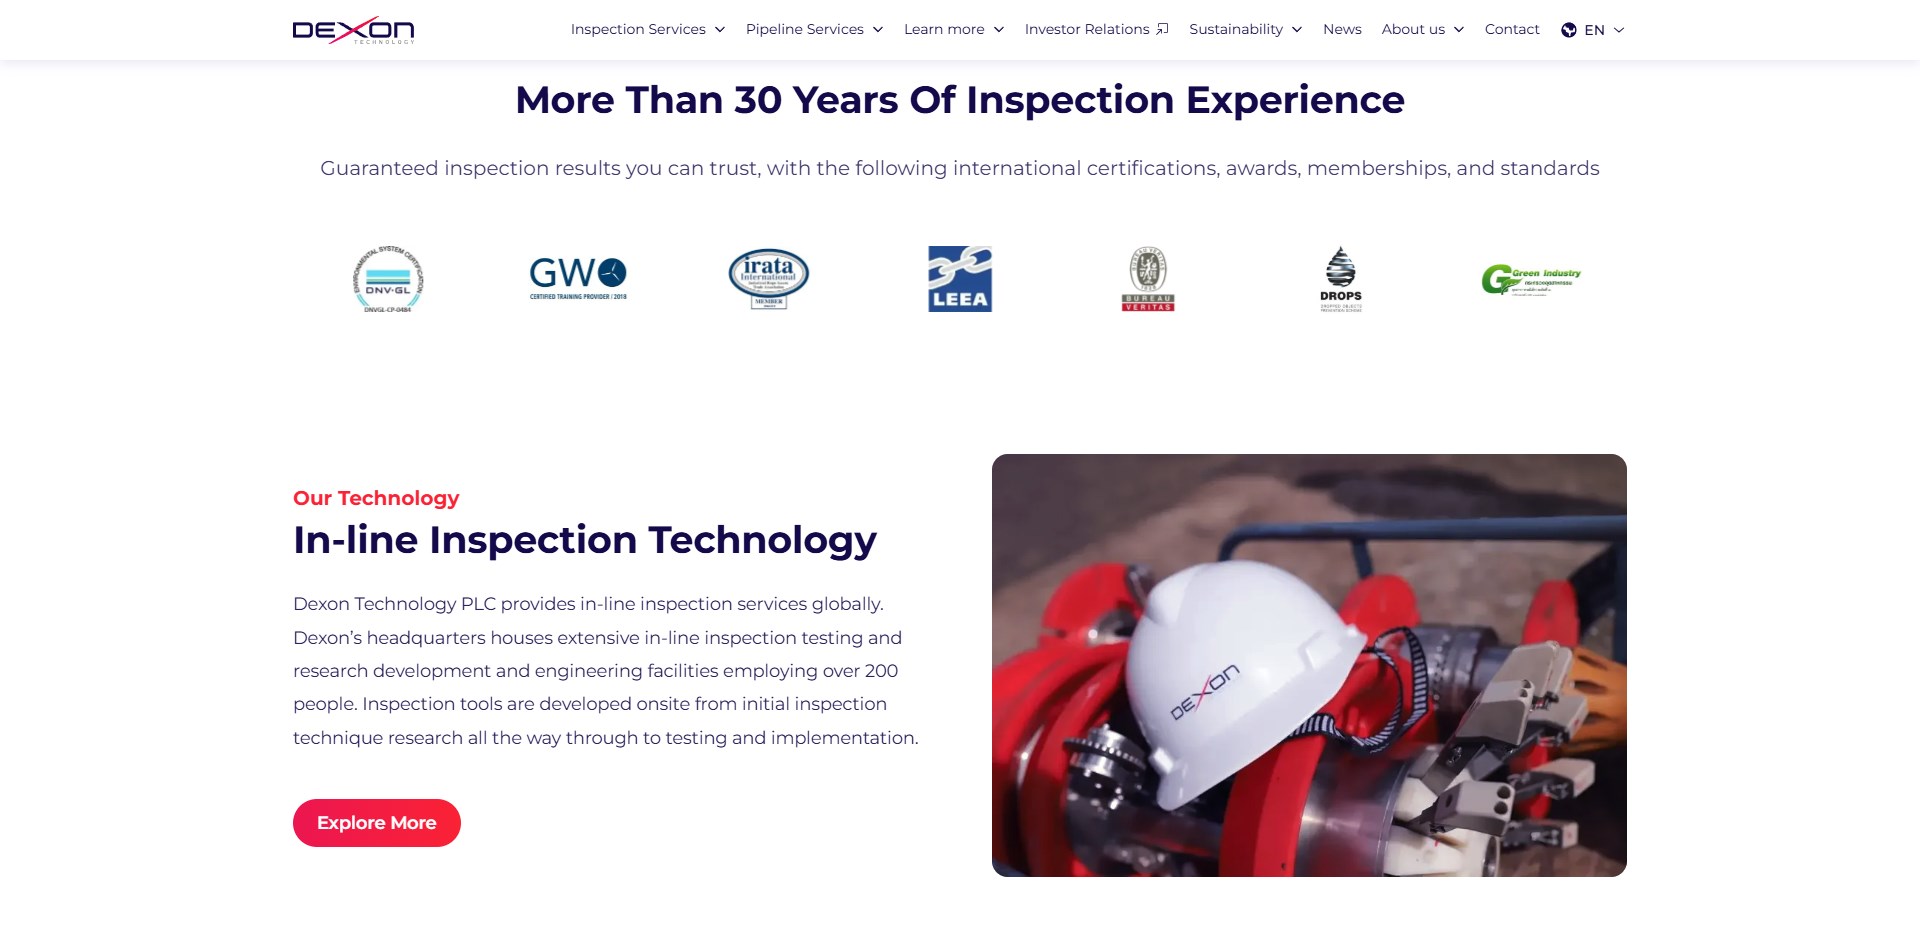
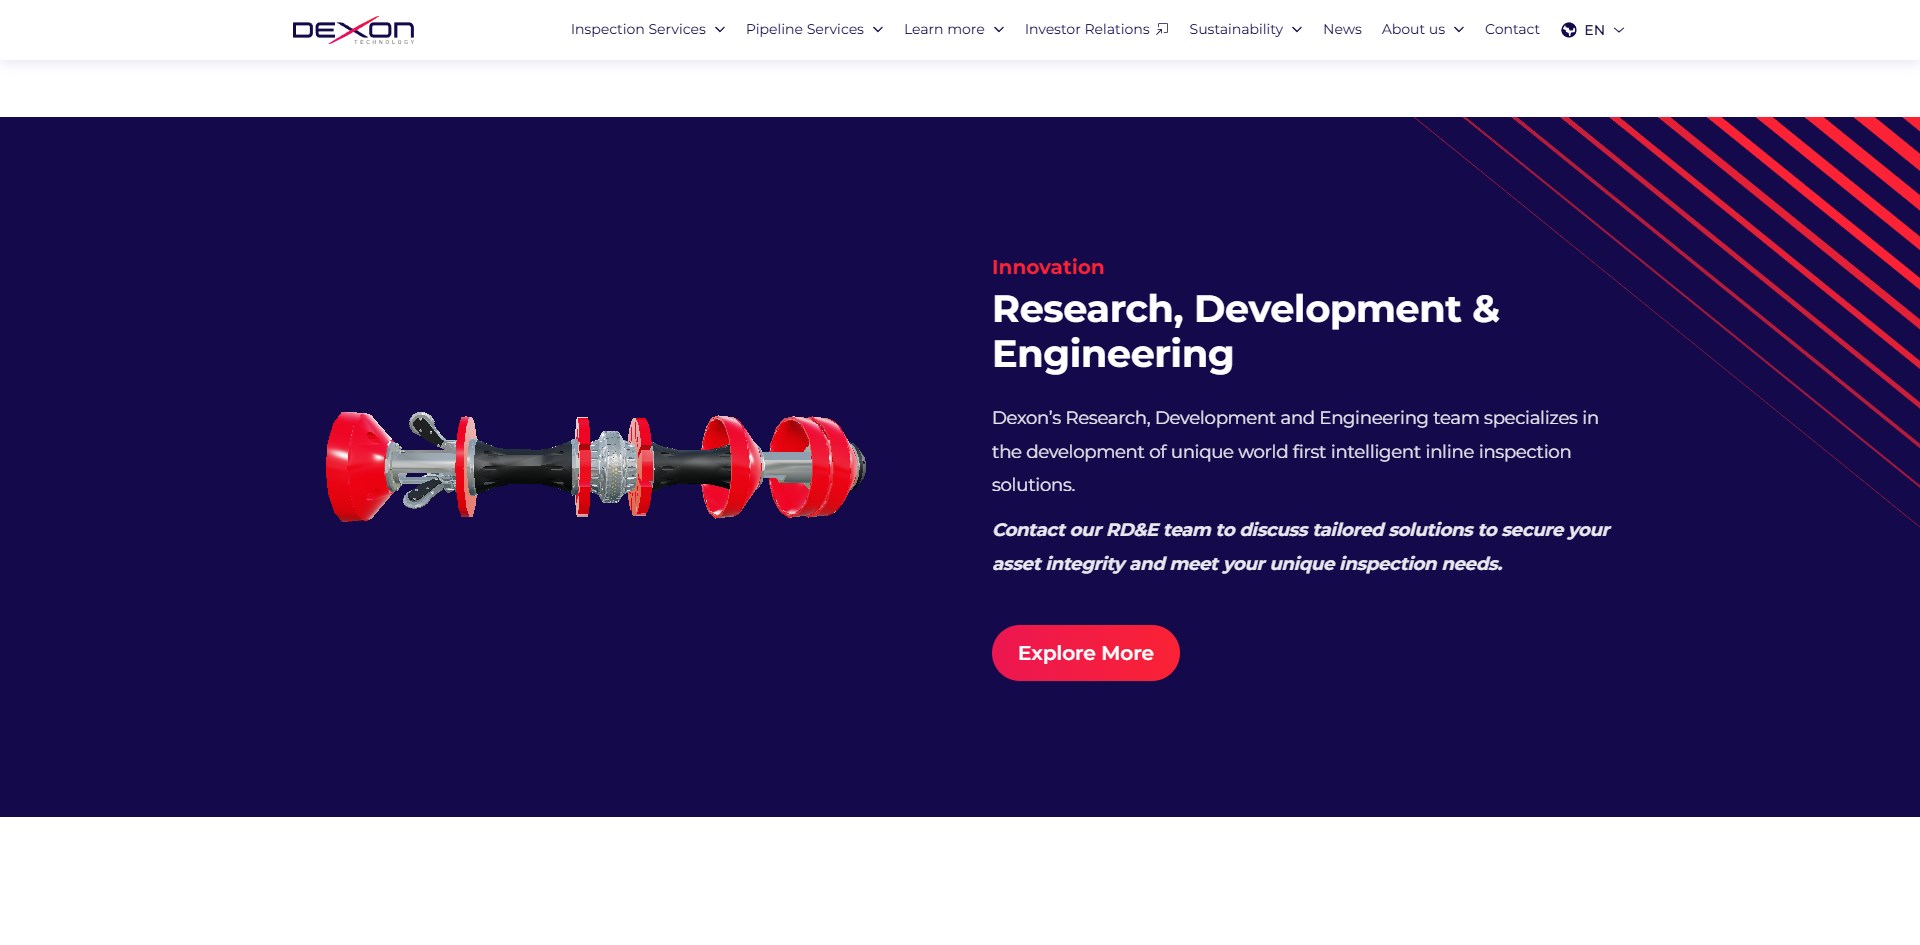
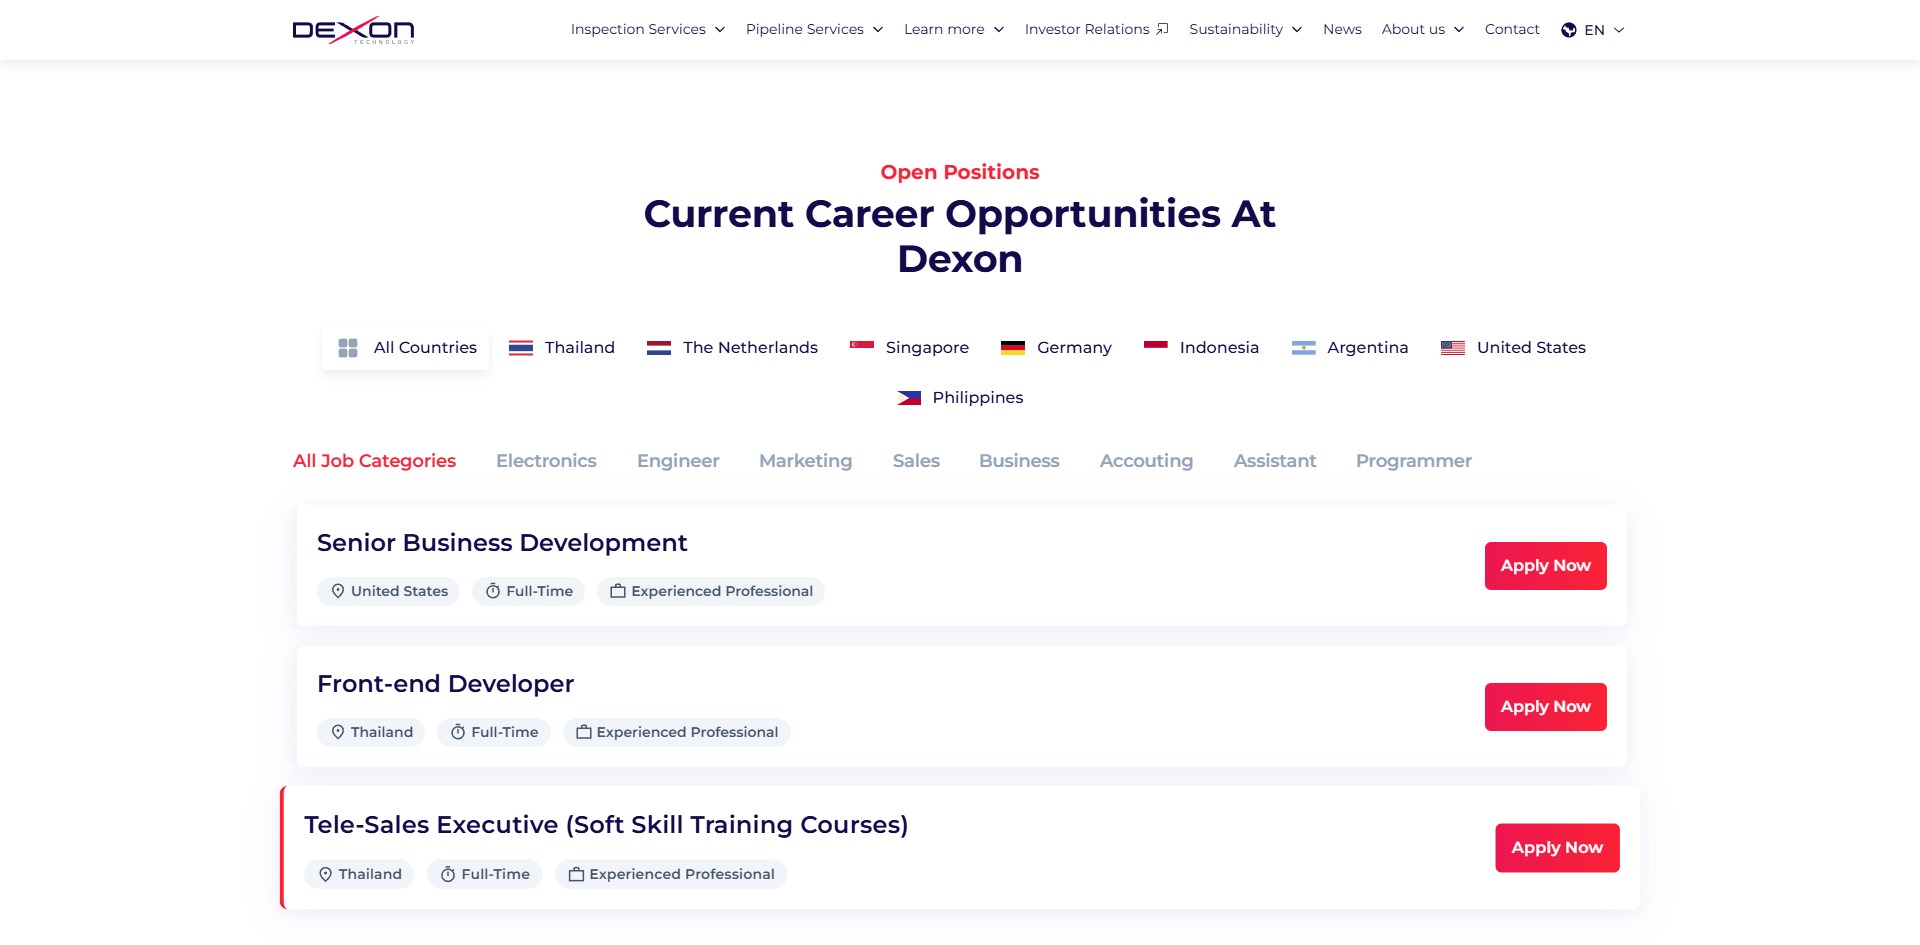
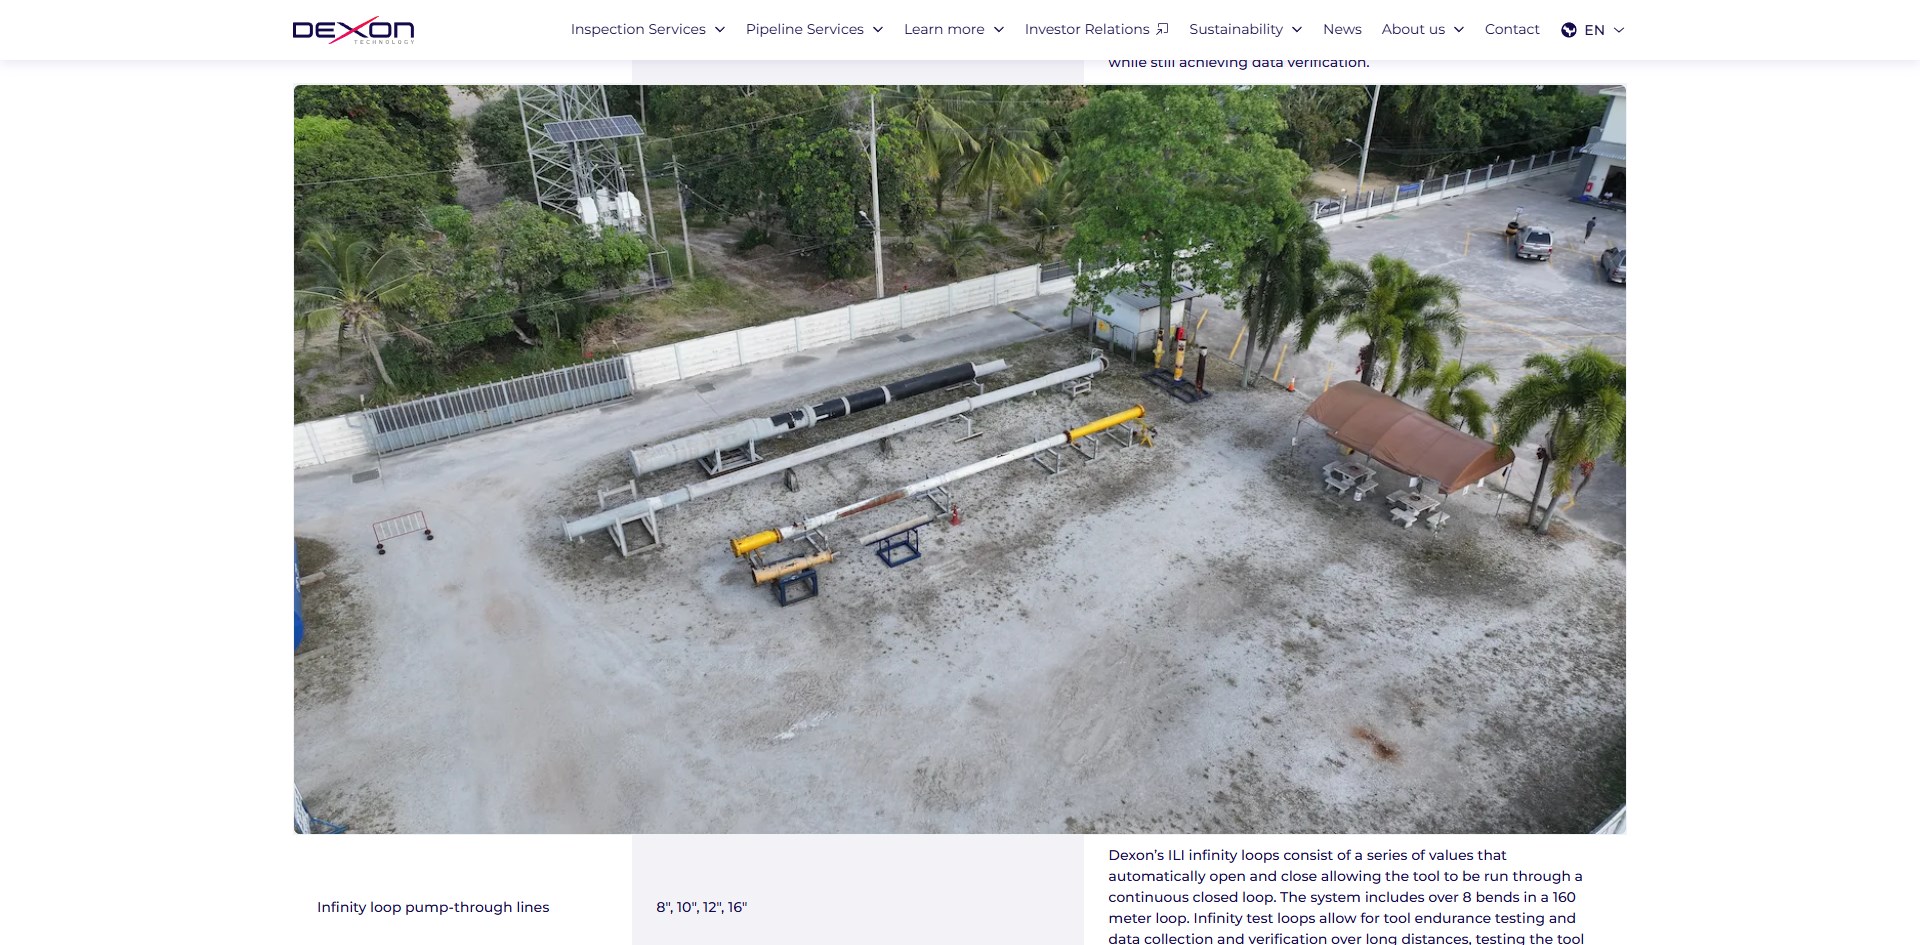
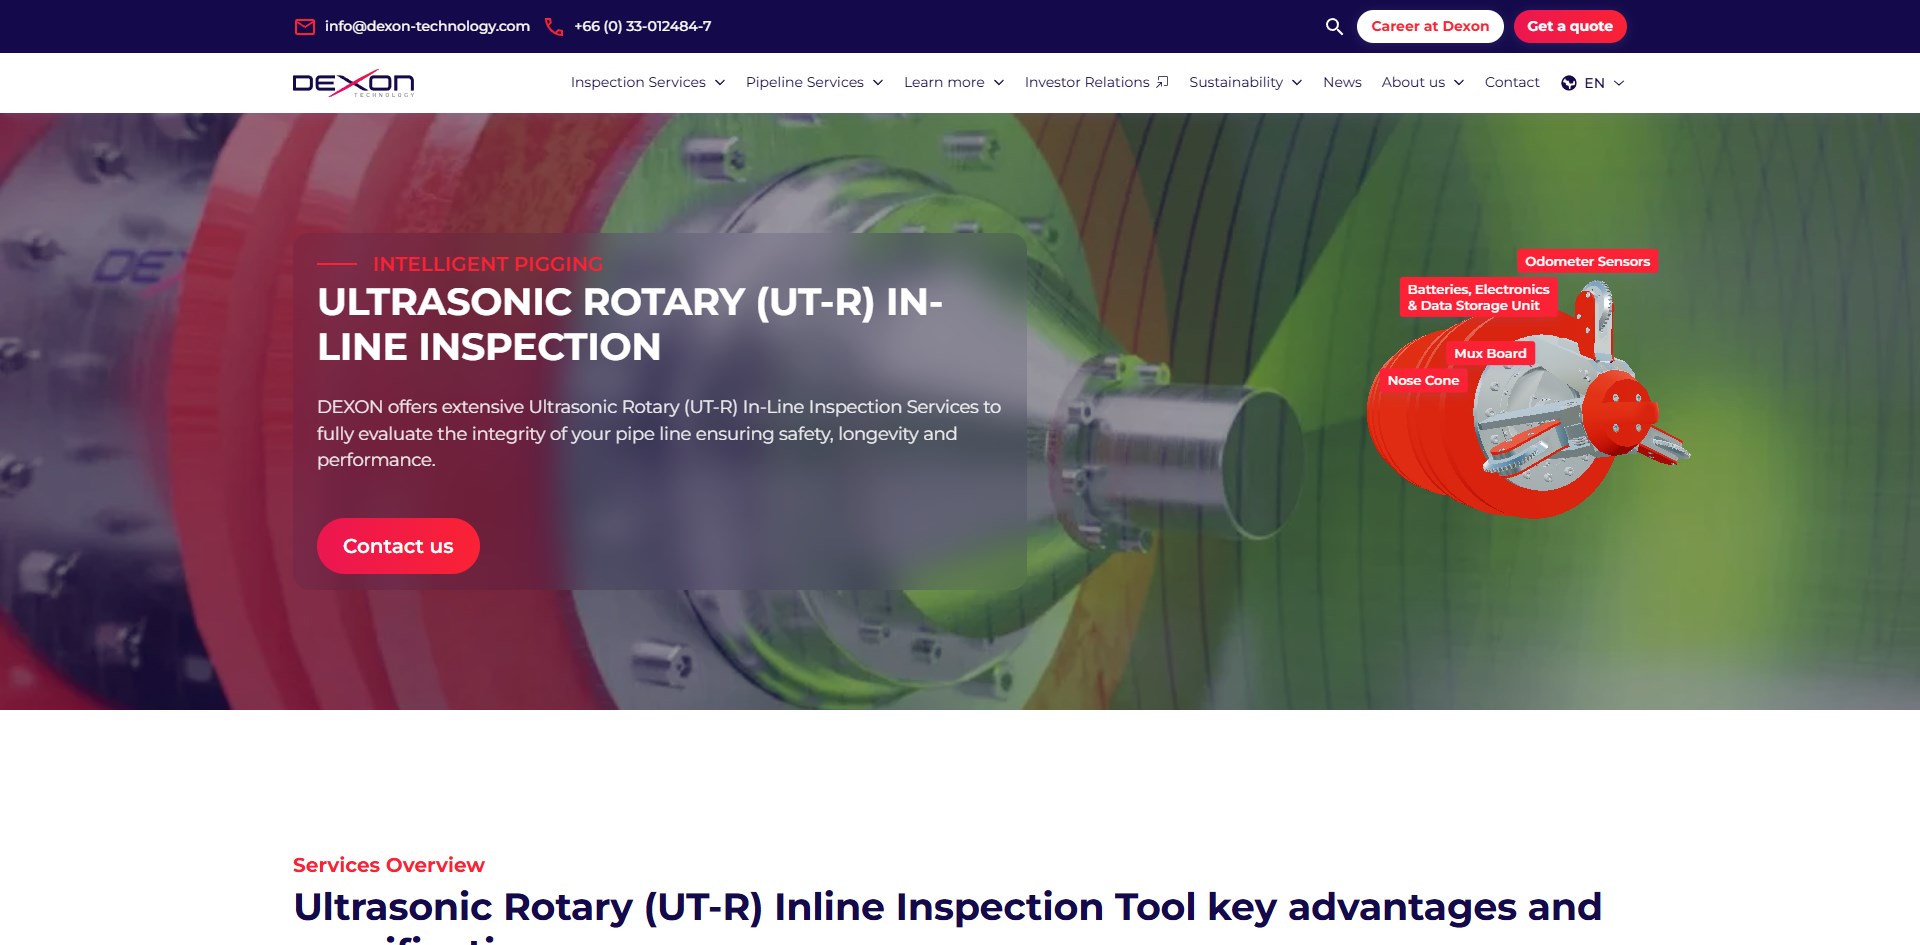
Screens & deliverables.
The full story.
We built the bridge between raw industrial data and human decision-making for a pipeline inspection platform–transforming complex technical datasets into actionable insights for asset integrity management.
One of the core challenges was providing spatial context for inspection data that spans hundreds of kilometers of pipeline infrastructure. We solved this by engineering an interactive Google Maps API module that plotted complete inspection routes with defect heatmaps and annotations.
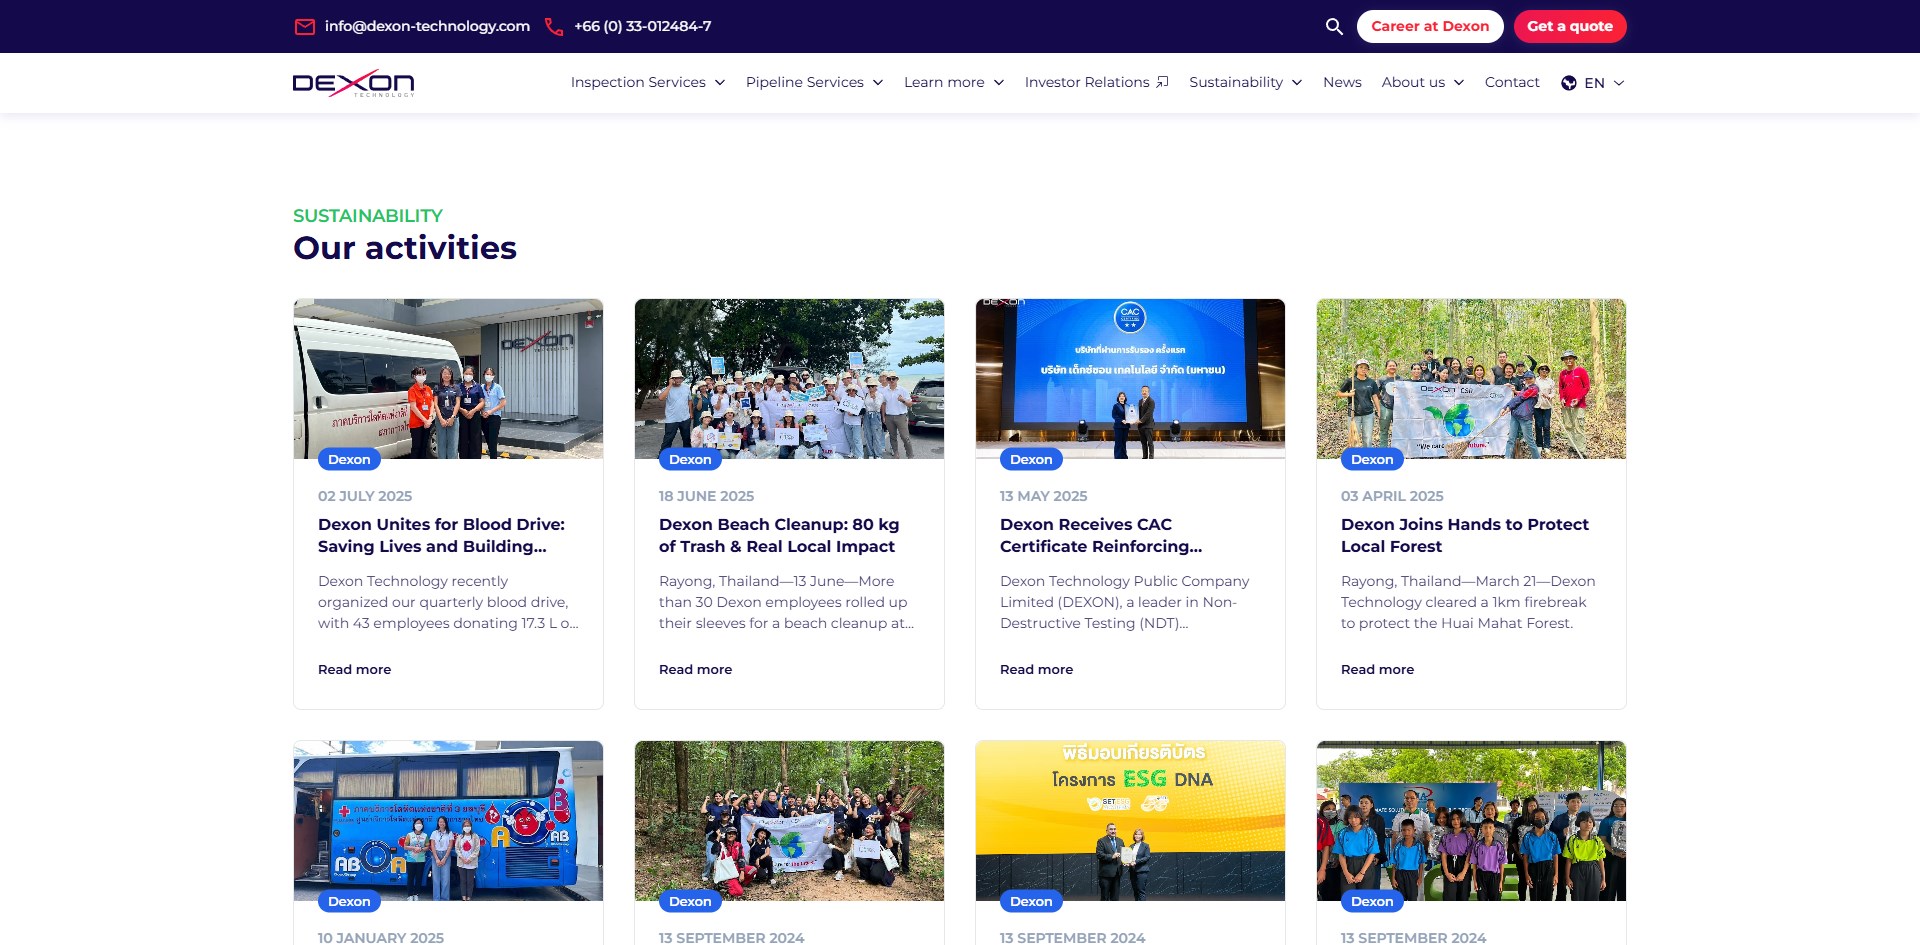
A key innovation was the integration of Storyblok CMS, transforming static inspection reports into dynamic, editable documents for global field teams.
Under the hood, the platform leverages Vue.js and Nuxt.js, Google Maps API, Storyblok CMS, Vuex for real-time data streams, and strategic caching and lazy-loading for performance at scale.
More in Digital Product.
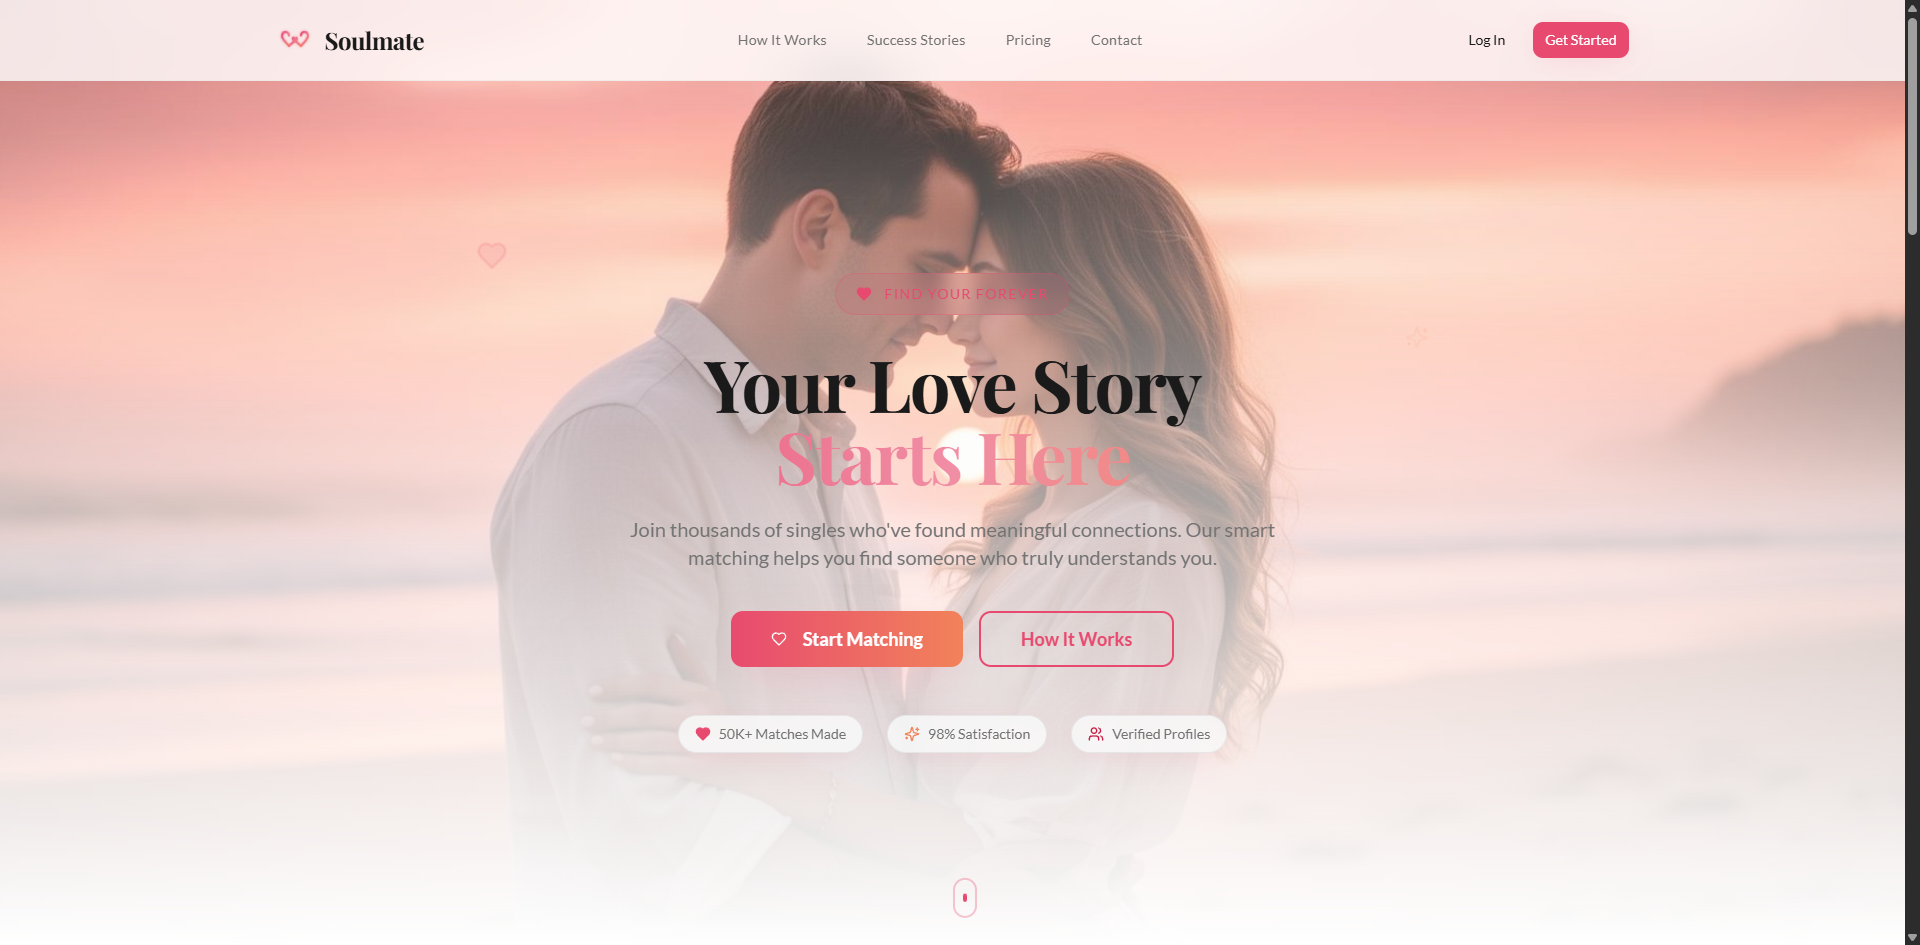
Dating Web App
A real-time dating application enabling users to discover profiles, establish mutual matches, and engage in seamless conversations–all powe…
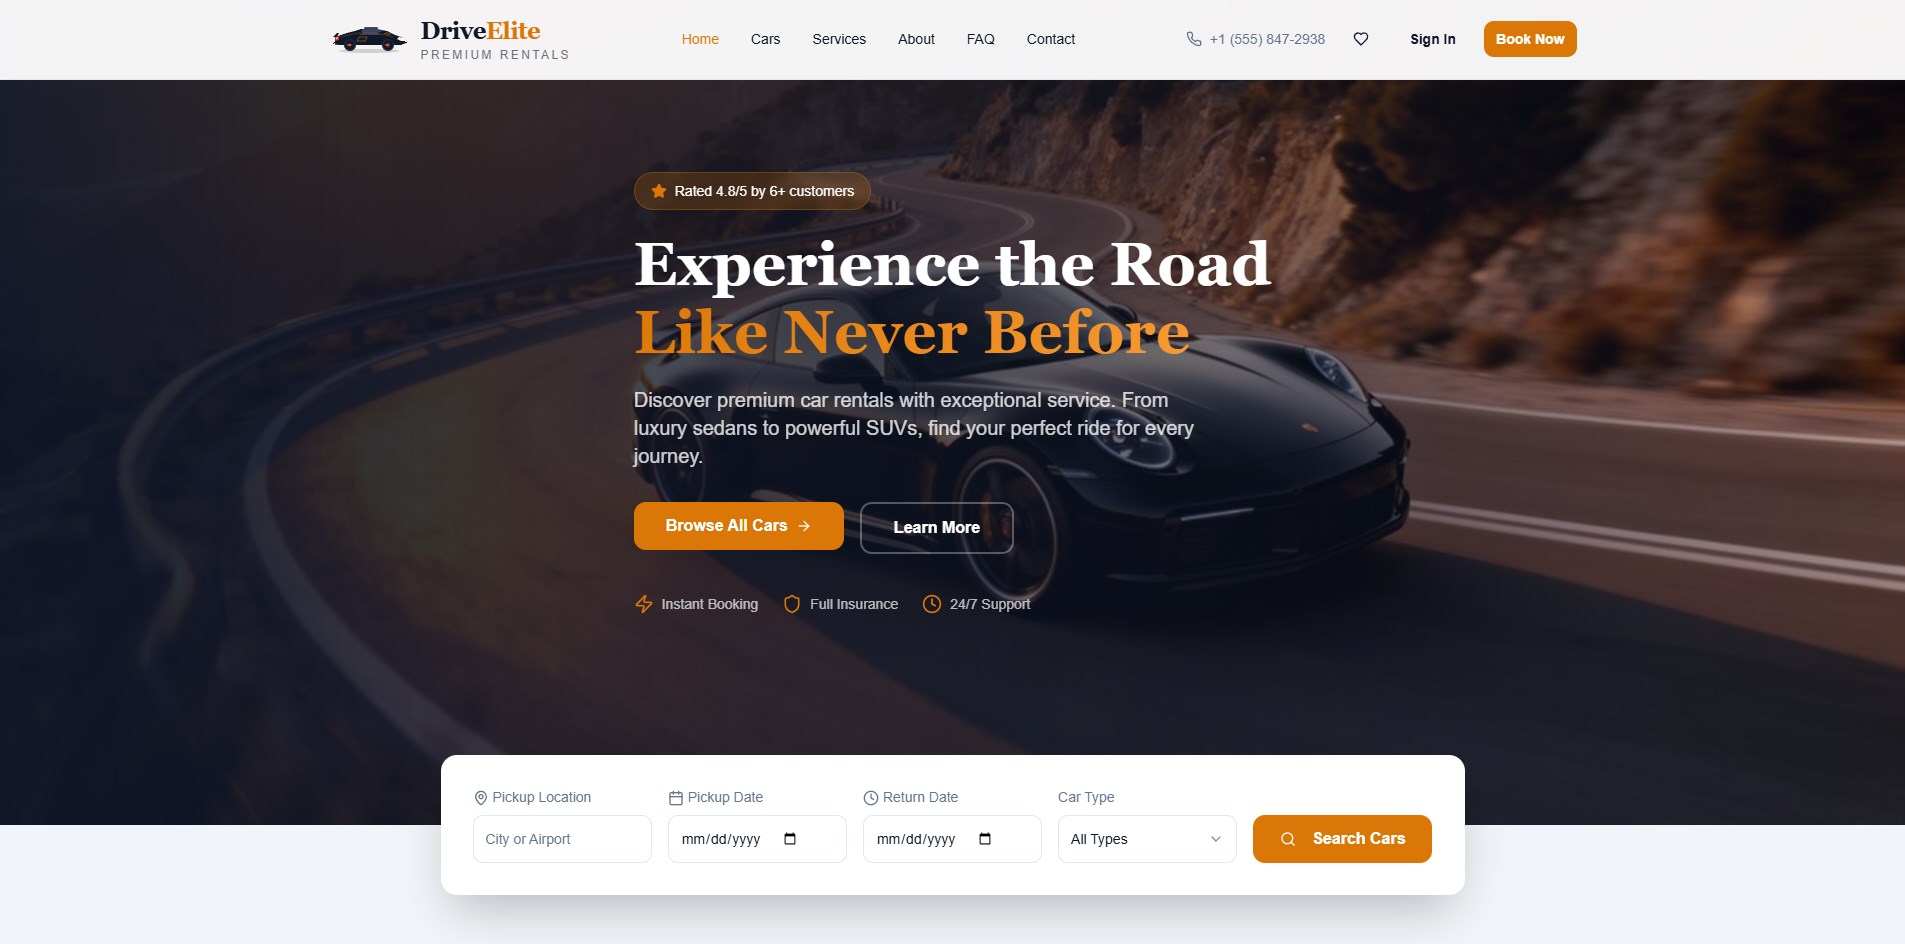
Car Rental Platform
A reservation and payment platform streamlining car rentals by allowing users to browse available vehicles, select dates, and complete book…